
As a sysadmin, you want to know what’s happening on your environment so you have a chance to fix an issue before it impacts users. Maybe you want to have some monitoring so you can see when something (break glass account?) Is being used that shouldn’t be. I have blogged about setting up Graylog for collating all my event logs from my machines. Since this, I have subsequently set up Zabbix for collecting performance stats and monitoring of services. I have also set up a server for running Grafana which will display the data from both Zabbix and the Elasticsearch associated with Graylog.
Zabbix was quite hard work to get up and running, maybe I should have blogged about doing this but I didn’t. Needless to say, Zabbix is up and running on an Ubuntu server running on the ESXi estate. Grafana is also set up on a Ubuntu server on the ESXi estate. Grafana was a much simpler installation process. I have added the Zabbix plugin to Grafana and configured it to point at the Zabbix server.
When configuring the Zabbix server, it is well worth adding BITS and TrustedInstaller as two services not to inventory and subsequently monitor. These two services create a lot of noise in Zabbix. One of the key things about monitoring solutions is to ensure that they are not producing noise that you ignore. This is done by adding “|BITS|TrustedInstaller” to the {$SERVICE.NAME.NOT_MATCHES} Template Macro.
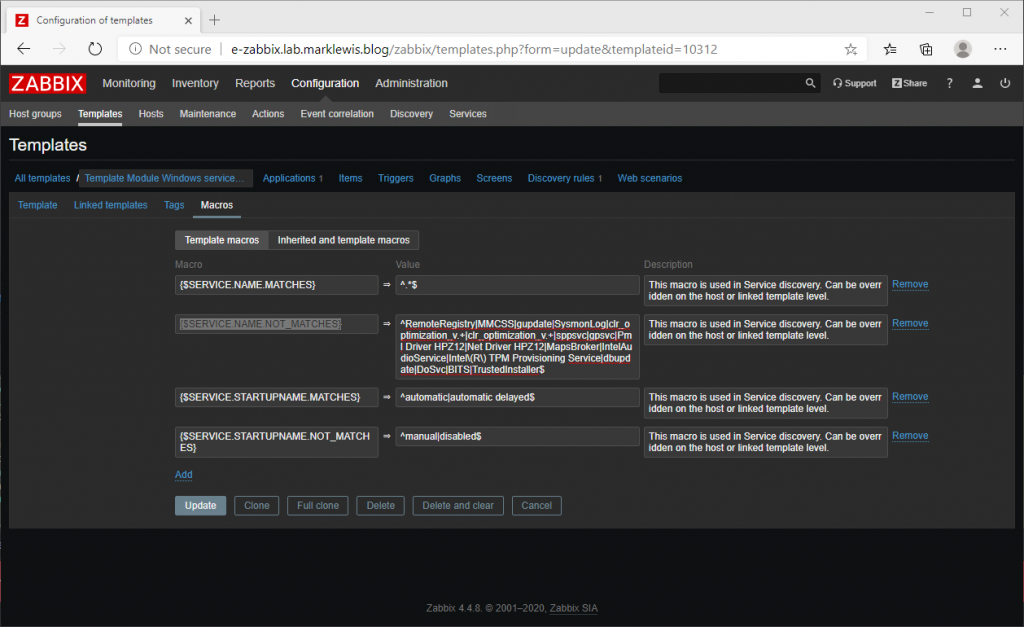
This helps prevent Zabbix showing up with warnings that can safely be ignored. Depending on your environment, you might have other services such as Edge Update.
To get servers reporting in to Zabbix, you can deploy the agent. This works for Windows and Linux servers. Hosts are added to the system using the configuration menu option where details such as the hostname/IP address are configured, which host group to add the machine to and which templates to apply. With the agent deployed and configured, shortly afterwards you should start to see data appearing within the Graphs tab of the monitoring menu. With the data reporting in I worked on building up the following Active Directory performance dashboard in Grafana:
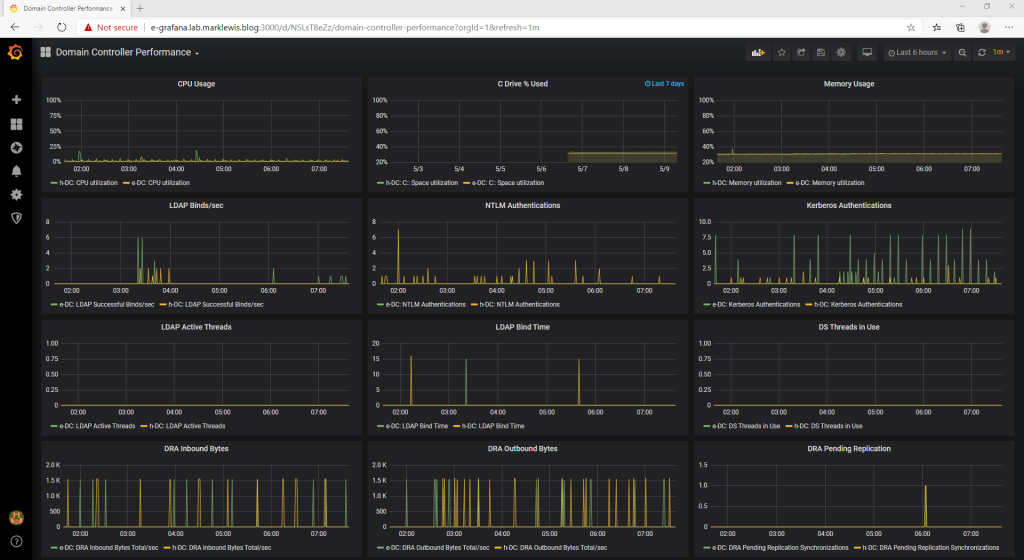
This dashboard I have had success with detecting problems in an AD environment within several environments. The top row represents server performance, the second row gives an overview of authentication traffic, the 3rd row shows LDAP based information and the bottom row gives an overview of replication performance. Every environment is different, I can’t say this should alert based on this value. 80% RAM usage might be normal for one environment but alarming for another. The pending replication count being high would indicate a replication problem which you would need to investigate. With the dashboard in place, you can evaluate what your normal is and then set any alarms based on that. To get the stats in to Zabbix, I added the Template AD DS Health and Performance template. This works well but I did find I had to make some changes to the perf counters that are being collected as some of the number references did not work on my 2019 Server Core domain controllers. The screen below shows you how I have my performance counters configured within the template:
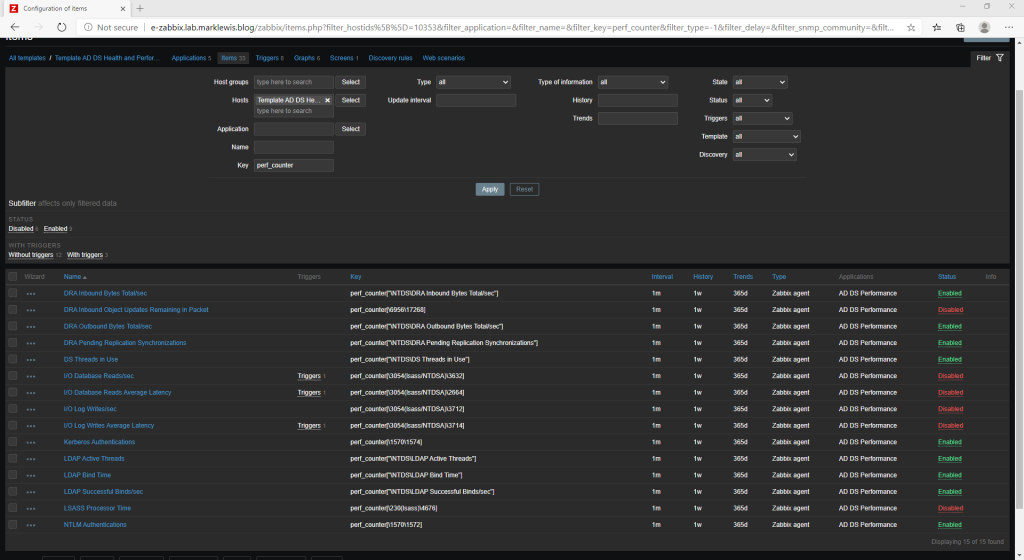
This setup falls in line with a previous solution I have used where a PowerShell script was sending the data in to Graphite. Although the PowerShell script might have been slightly lighter weight, I think the use of Zabbix is slightly easier to tweak and manage.
Now Zabbix is working wonders, and Grafana is helping display performance counters so we can potentially identify issues before a user does, what else can we do. Well, I am a massive fan of Microsoft Azure and Log Analytics. It’s something I have deployed and used with great success a few times and with the new Azure Sentinel helping to analyze and alert on the data, it’s even better. BUT … for a home lab environment the cost of running Log Analytics and Sentinel can soon mount up, with the AD auditing cranked right up, it can get expensive quickly. What about those companies that don’t have a cloud presence, or are completely against using Azure (maybe they’re a Google shop). Well, we set up Graylog previously so we have our logs in a central location. Graylog makes use of Elasticsearch, so we can tap in to that with Grafana to start mimicking some of the functionality of Sentinel.
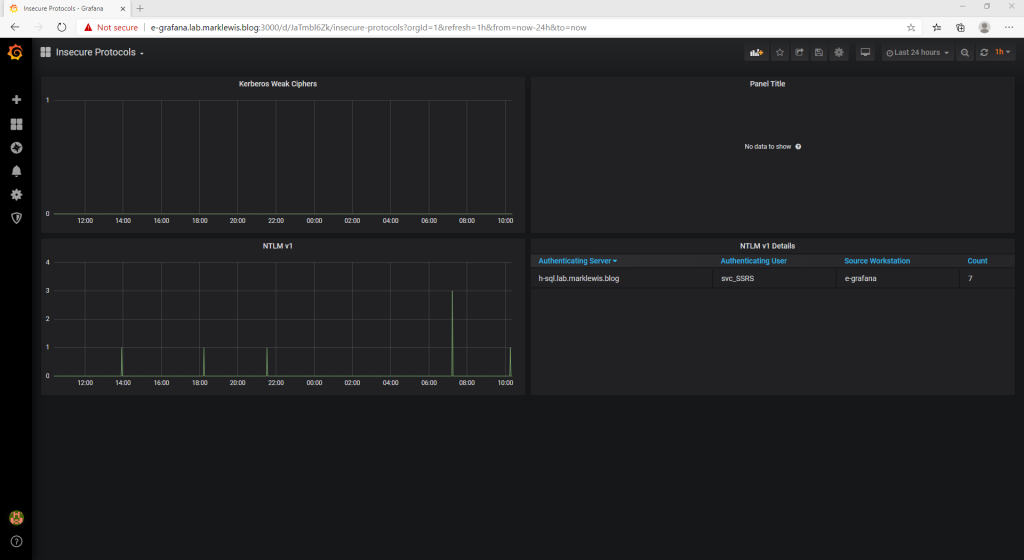
So, how are we going to do this? Well, some of the information that Sentinel displays includes Insecure Protocols. This shows use of NTLM v1, SMB 1, Legacy Authentication (Azure AD), Weak Kerberos encryption and WDigest authentication. To replicate some of this information, I am targeting Weak Kerberos encryption, NTLM v1 and SMB 1. The screen below shows the data coming in from Graylog and replicating the insecure protocols from Sentinel.
The queries used for the Kerberos and NTLM details are as follows:
Kerberos:
(EventID: 4768 OR EventID: 4769) AND (NOT TicketEncryptionType: 0x12 AND NOT TicketEncryptionType: 0x11) AND level: 8
NTLM:
EventID: 4624 AND AuthenticationPackageName: "NTLM" AND LmPackageName: "NTLM V1" AND NOT TargetUserName: "ANONYMOUS LOGON"
At the moment, in a full Windows 2019/Windows 10 environment, I am not seeing any use of weaker encryption levels for Kerberos. I am seeing NTLM v1 authentication though from my Grafana server to the SQL server. This is because I am building some SCCM based dashboards. The last thing to add to the above screen will be SMBv1 reports, however as SMBv1 is not installed by default, I need to work out how to get some SMBv1 traffic flowing.
Once I have finished the dashboards, I will see if I can upload them to GitHub so that you can start making use of them in your environment. Given that there is no license cost involved to any of this, I appreciate I might have over complicated things a little with 3 separate VMs, but this is well worth doing. Anything found on the Insecure Protocols dashboard should be investigated and rectified. Hopefully now, you can fix an issue before users start complaining.